dimarts, 9 de febrer del 2016

diumenge, 13 de setembre del 2015

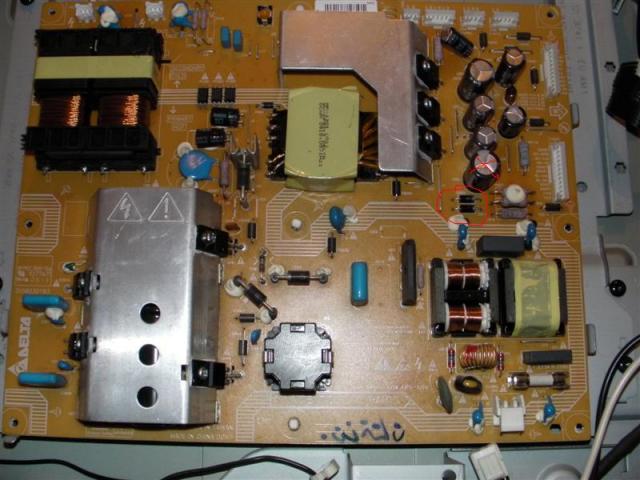
philips - dps-298cp-4a

el televisor no hace nada.
el testigo stand-by no se ilumina
al cambiar los diodos se ha resuelto


dijous, 19 de febrer del 2015

dijous, 5 de febrer del 2015

running Desktop Console from batch file

next section comes from link

If you may wan to run Desktop Console from a batch file, for example RDC over VPN, you can use mstsc /v:servername /console command.
Mstsc
Creates connections to terminal servers or other remote computers, edits an existing Remote Desktop Connection (.rdp) configuration file, and migrates legacy connection files that were created with Client Connection Manager to new .rdp connection files.
Syntax
mstsc.exe {ConnectionFile | /v:ServerName[:Port]} [/console] [/f] [/w:Width /h:Height]
mstsc.exe /edit"ConnectionFile"
mstsc.exe /migrate
Parameters
ConnectionFile
Specifies the name of an .rdp file for the connection.
/v:ServerName[:Port]
Specifies the remote computer and, optionally, the port number to which you want to connect.
/console
Connects to the console session of the specified Windows Server 2003 family operating system.
/f
Starts Remote Desktop connection in full-screen mode.
/w:Width /h:Height
Specifies the dimensions of the Remote Desktop screen.
/edit"ConnectionFile"
Opens the specified .rdp file for editing.
/migrate
Migrates legacy connection files that were created with Client Connection Manager to new .rdp connection files.
Remarks
  • You must be an administrator on the server to which you are connecting to create a remote console connection.
  • default.rdp is stored for each user as a hidden file in My Documents. User created .rdp files are stored by default in My Documents but can be moved anywhere.
Examples
To connect to the console session of a server, type:
mstsc /console
To open a file called filename.rdp for editing, type:
mstsc /edit filename.rdp

diumenge, 25 de gener del 2015

FROM ARDUINO TO MATPLOTLIB

http://www.toptechboy.com/tutorial/python-with-arduino-lesson-11-plotting-and-graphing-live-data-from-arduino-with-matplotlib/

FROM ARDUINO YUN SIDE
1
2
3
4
5
6
7
8
9
10
11
12
13
14
15
16
17
18
19
20
21
22
23
24
#include "Wire.h"    // imports the wire library for talking over I2C
#include "Adafruit_BMP085.h"  // import the Pressure Sensor Library
Adafruit_BMP085 mySensor;  // create sensor object called mySensor
 
float tempC;  // Variable for holding temp in C
float tempF;  // Variable for holding temp in F
float pressure; //Variable for holding pressure reading
 
void setup(){
Serial.begin(115200); //turn on serial monitor
mySensor.begin();   //initialize mySensor
}
 
void loop() {
tempC = mySensor.readTemperature(); //  Be sure to declare your variables
tempF = tempC*1.8 + 32.; // Convert degrees C to F
pressure=mySensor.readPressure(); //Read Pressure
 
 
Serial.print(tempF);
Serial.print(" , ");
Serial.println(pressure);
delay(250); //Pause between readings.
}

FROM PYTHON 2.7 SIDE
import serial # import Serial Library
import numpy  # Import numpy
import matplotlib.pyplot as plt #import matplotlib library
from drawnow import *

tempF= []
pressure=[]
arduinoData = serial.Serial('COM8', 9600) #Creating our serial object named arduinoData
plt.ion() #Tell matplotlib you want interactive mode to plot live data
cnt=0

def makeFig(): #Create a function that makes our desired plot
    plt.ylim(80,90)                                 #Set y min and max values
    plt.title('My Live Streaming Sensor Data')      #Plot the title
    plt.grid(True)                                  #Turn the grid on
    plt.ylabel('Temp F')                            #Set ylabels
    plt.plot(tempF, 'ro-', label='Degrees F')       #plot the temperature
    plt.legend(loc='upper left')                    #plot the legend
    plt2=plt.twinx()                                #Create a second y axis
    plt.ylim(93450,93525)                           #Set limits of second y axis- adjust to readings you are getting
    plt2.plot(pressure, 'b^-', label='Pressure (Pa)') #plot pressure data
    plt2.set_ylabel('Pressrue (Pa)')                    #label second y axis
    plt2.ticklabel_format(useOffset=False)           #Force matplotlib to NOT autoscale y axis
    plt2.legend(loc='upper right')                  #plot the legend
    

while True: # While loop that loops forever
    while (arduinoData.inWaiting()==0): #Wait here until there is data
        pass #do nothing
    arduinoString = arduinoData.readline() #read the line of text from the serial port
    dataArray = arduinoString.split(',')   #Split it into an array called dataArray
    temp = float( dataArray[0])            #Convert first element to floating number and put in temp
    P =    float( dataArray[1])            #Convert second element to floating number and put in P
    tempF.append(temp)                     #Build our tempF array by appending temp readings
    pressure.append(P)                     #Building our pressure array by appending P readings
    drawnow(makeFig)                       #Call drawnow to update our live graph
    plt.pause(.000001)                     #Pause Briefly. Important to keep drawnow from crashing
    cnt=cnt+1
    if(cnt>50):                            #If you have 50 or more points, delete the first one from the array
        tempF.pop(0)                       #This allows us to just see the last 50 data points
        pressure.pop(0)